Trade the Market 06-8-2009
admin on 06 8, 2009
As opposed to most Mondays of late the markets in the US and abroad are actually selling off. Some are selling off rather significantly. The high that our charts show for the DOW since this amazing run began about 3 months ago is 8839. That’s about 2 ½ percent below the 9050ish number that we’ve bee working with as our upside target. There’s no denying that the market seems to be tiring a wee bit or more in what could be the late stages of this rally or at least the late stages of the first wave of this rally. As we’ve noted a few times recently, it wouldn’t be the end of the world for the bulls if this market took yet another breather. That’s really where we see things coming back into focus. We need to see how this market reacts should it correct down to some key moving average levels / key support areas. Its behavior there is likely to dictate if this move is petering out or reenergizing for one more assault to the upside. We mentioned that we’d expect to see volatility and effectively “monkey business†around the the neckline to the current pattern and there’s no reason to change our feelings on that subject. But our trader’s intuition is telling us that smart bulls can’t be far from taking profits given the run that we’ve seen. We’re getting the sense that higher interest rates and oil prices and what they portend for the recovery theme are finally seeping into at least a few of the bulls’ thinking process.
We can never really know for sure what wiggle or waggle will be the last before a correction of significance begins in the opposite direction. Considering how close we’ve gotten to our upside target we’d be moving aggressively to secure profits at this point. We’d be happy to go into a “wait and see†approach and to trade shorter-term given the type of volatility that we expect to continue to see. We’ve yet to see the manic short-covering blowoff top that we’ve grown accustomed to seeing but it’s not as if that type of finish must appear before a significant correction can occur. It’s always about the probabilities for us and at this stage we’re willing to head towards neutral waters.
There’s going to be plenty of news and chatter this week as there is every week but the inter-market dynamics and technicals are what we believe will continue to hold sway even during a consolidation or correction should one unfold.
The Technical Picture:

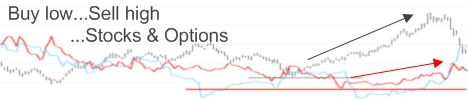
We’ve switched our color scheme around on this SPYs chart. It seems as though quite a few folks didn’t care for our white backgrounds with vibrant colors. Hopefully this will work better for them. We’ve kept the labeling to a minimum too as that was apparently getting in the way of the picture for too many readers as well. This is mainly a breadth chart that we review regularly. There isn’t a screaming sell signal at this point but we think that it’s clearly a time to expect a consolidation if not more. The momentum of the market seemed to wither somewhat last week. The market was unable to reach our projections so that tells us that things are either “over†for now or will take a little longer than we anticipated. We have a horizontal support line in RED that we’ve identified as our secondary support if the GRAY support line is penetrated. Our view is that we need to see how things are shaping up should the market head to these levels as we’d expect them to at this point.
Popular Posts
Recent Posts
Recent Comments
- CheapIV.com » Why You can Throw Traditional Diversification in the Trash: ... have spent their
- Tim Geithner – China’s Laughing Boy - Trade the E-minis: ... Learn how Timmy
- Tim Geithner – China’s Laughing Boy | Notes from the E-mini Trading Professor: ... Learn how Timmy
- Swing Trading Stock: ... Learn Timmy Next
- Timmy Geithner has Cried “Wolf” Too Many Times | THE ART OF EXCESS: ... Learn how Timmy